Client
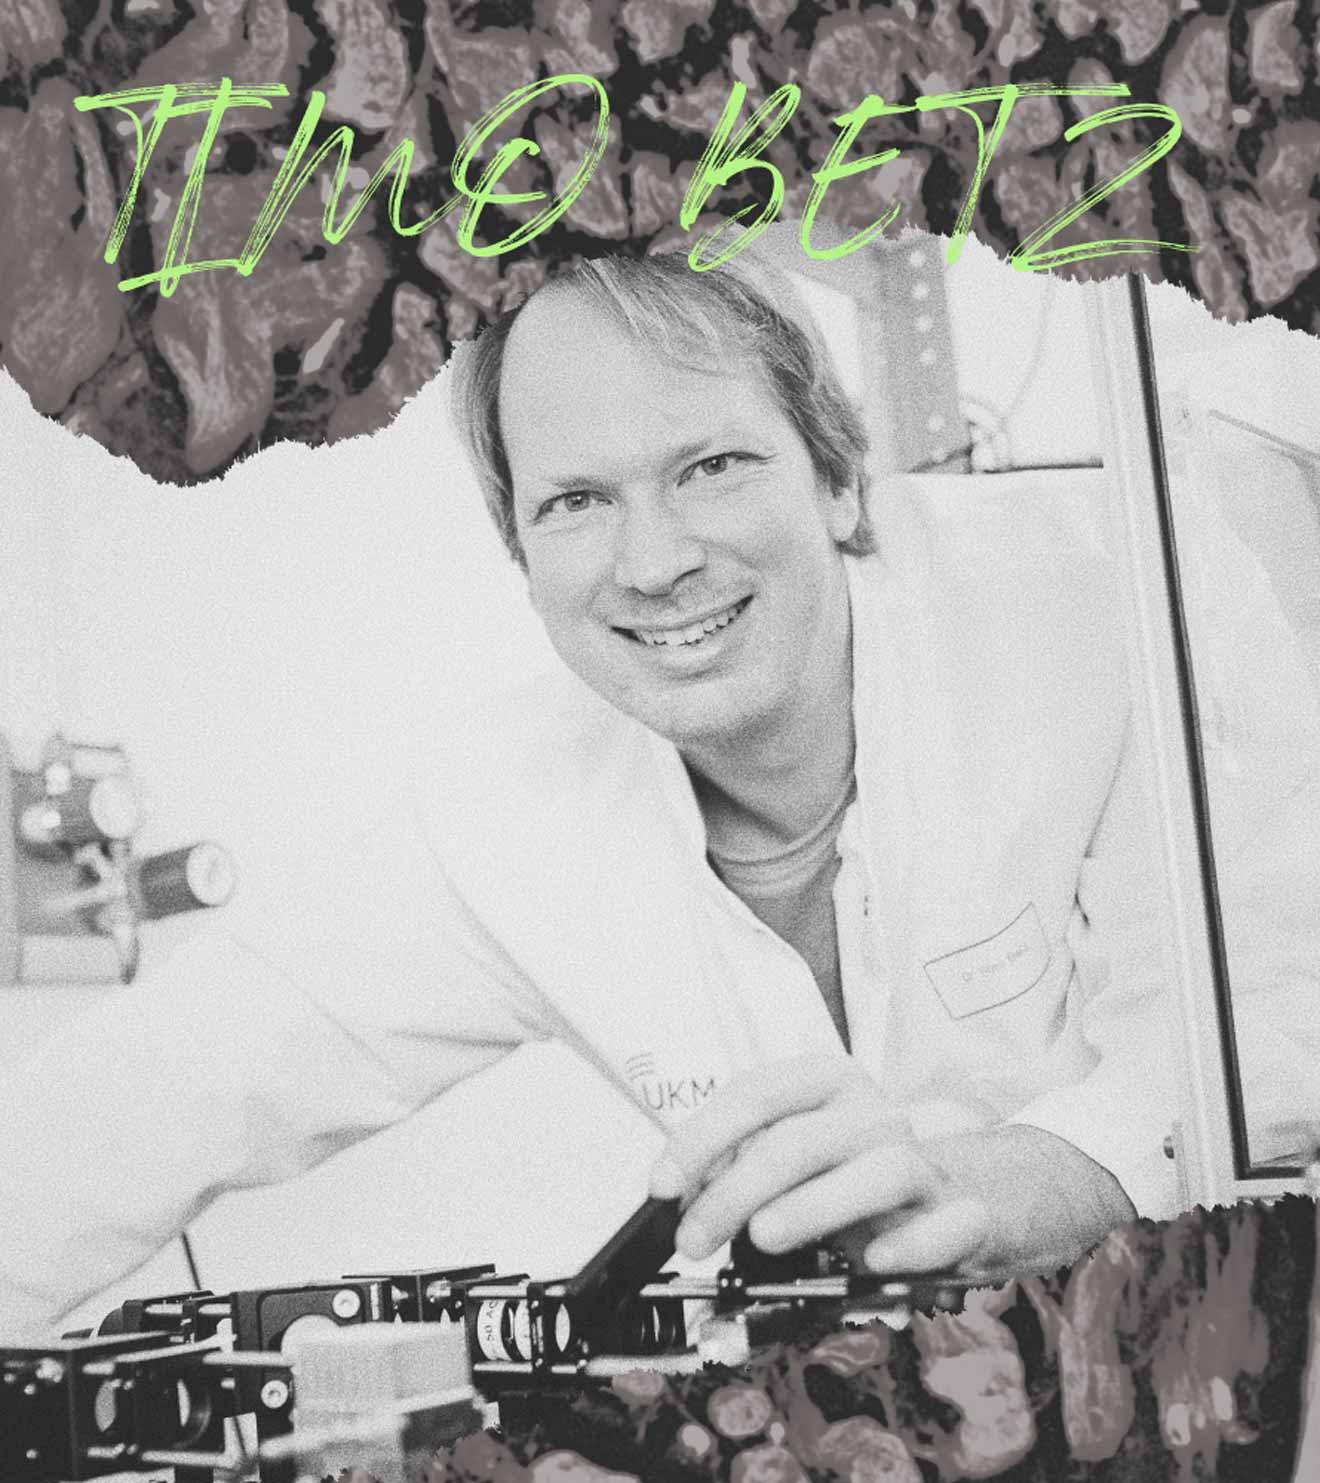
#BetzLab, led by Timo Betz at the University of Göttingen, studies how mechanical forces shape the way cells and tissues work together. The lab develops methods to measure forces and tension in tissue, membranes and filaments, using fluorescence microscopy and computer-vision algorithms to analyse the images.
Challenge
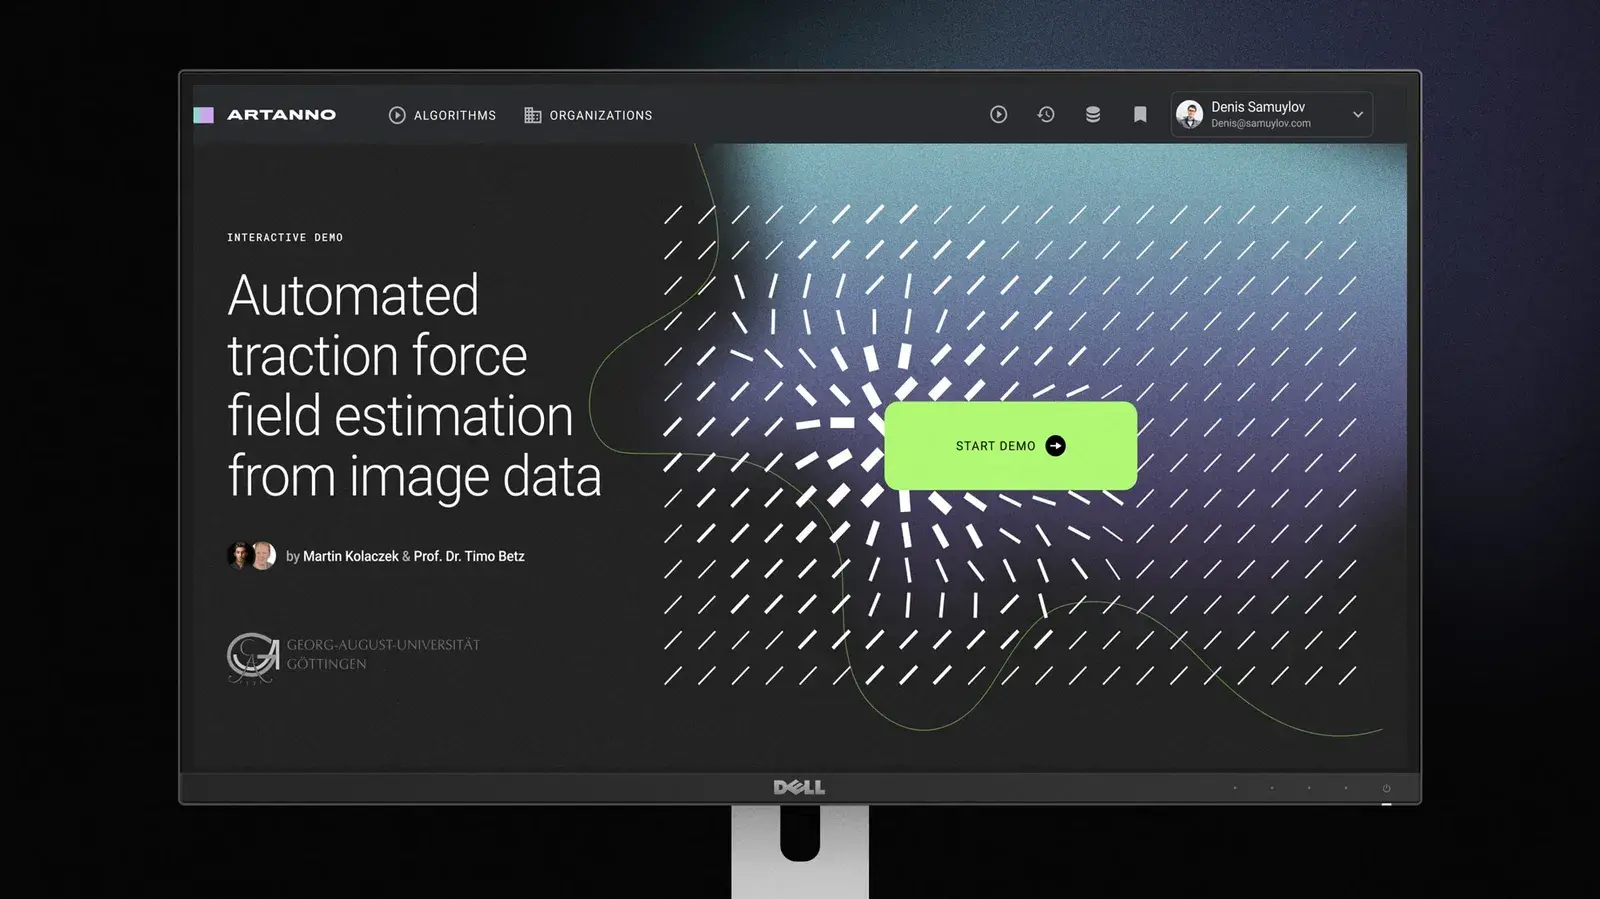
#The lab had developed an algorithm that turns microscopy images into a traction-force field: a map of the forces cells exert on the surface they sit on. That map is valuable for studying how cells work, but to use the algorithm, a collaborator had to install it and work out how to run it.
Those collaborators came from different fields, many without programming experience. They needed to run the analysis themselves, without writing code, and without unsuitable data or settings silently producing a wrong result.
Our approach
#We designed a web application, so collaborators need only a browser. Four decisions shaped it.
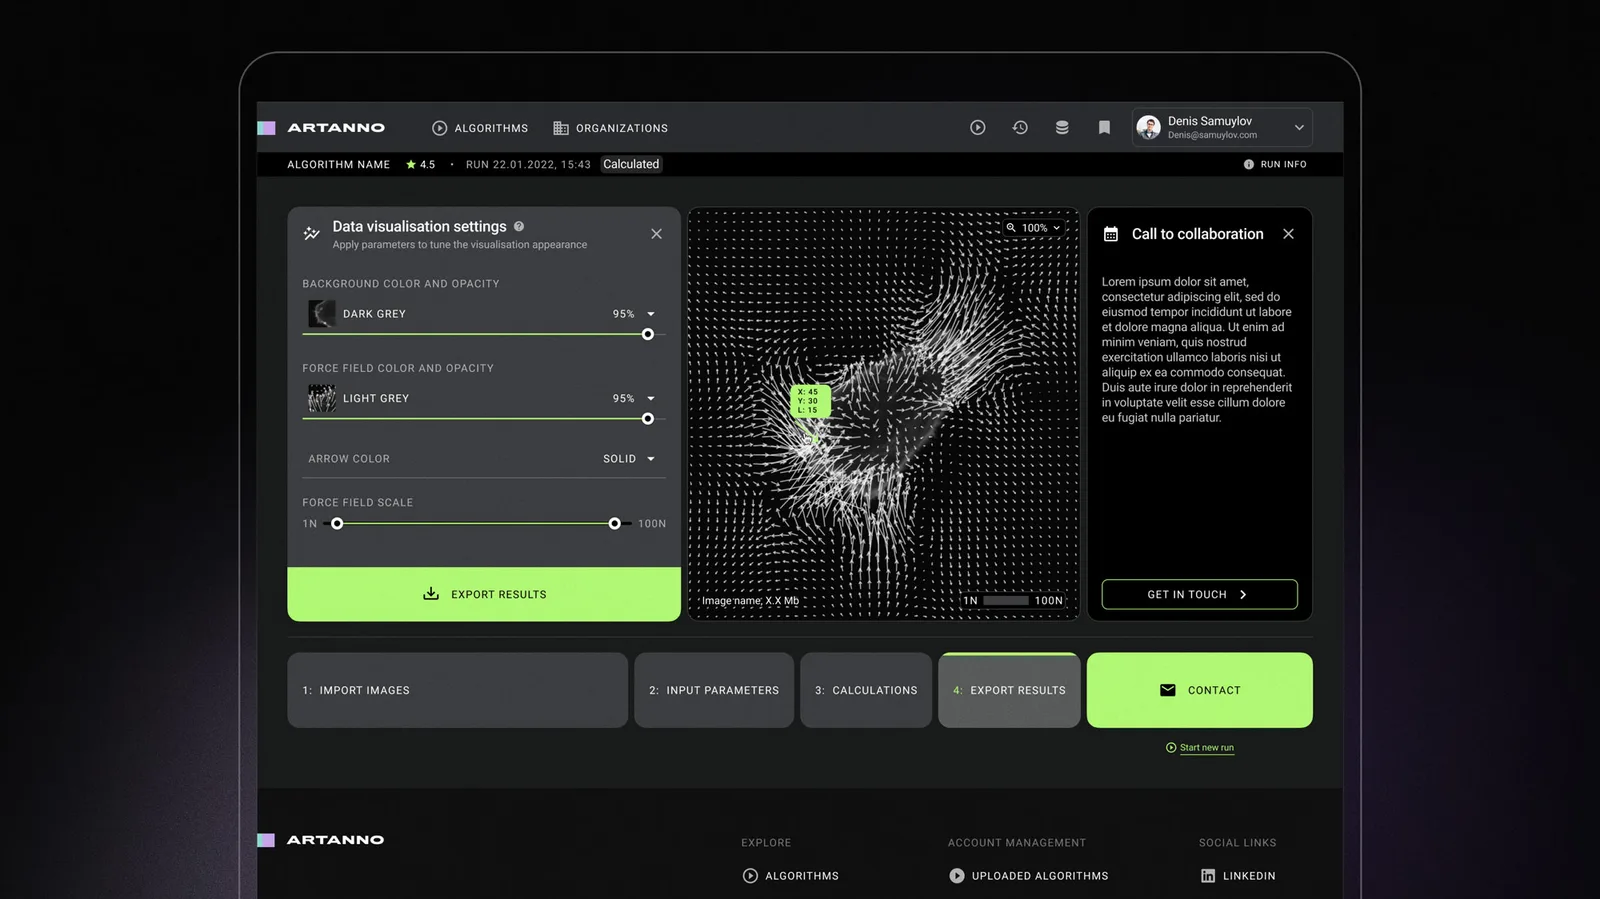
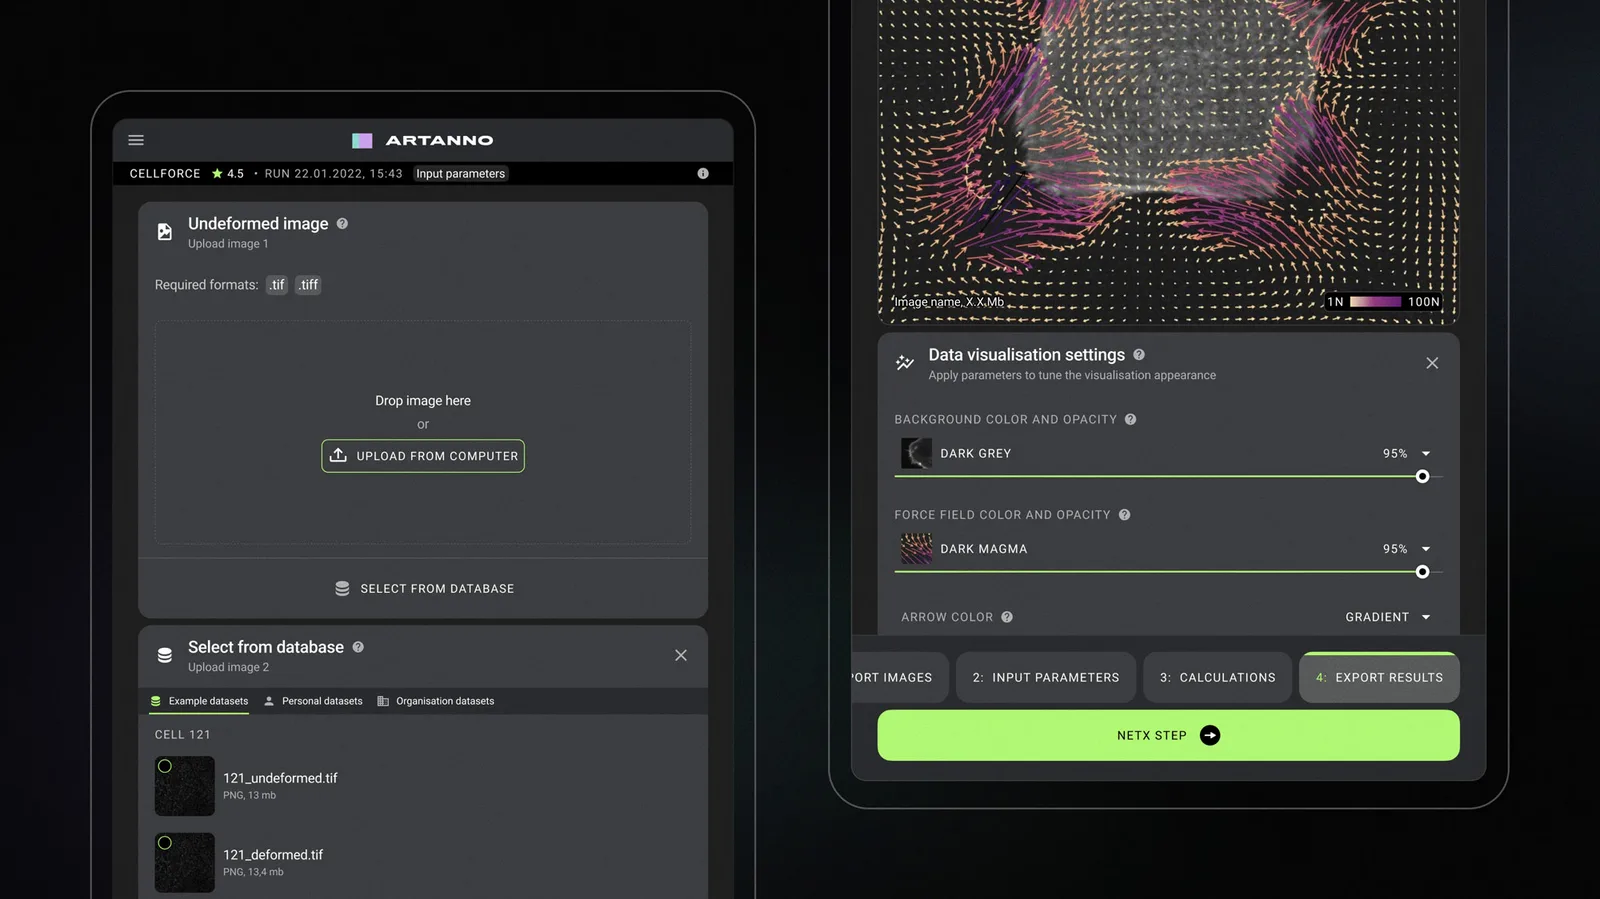
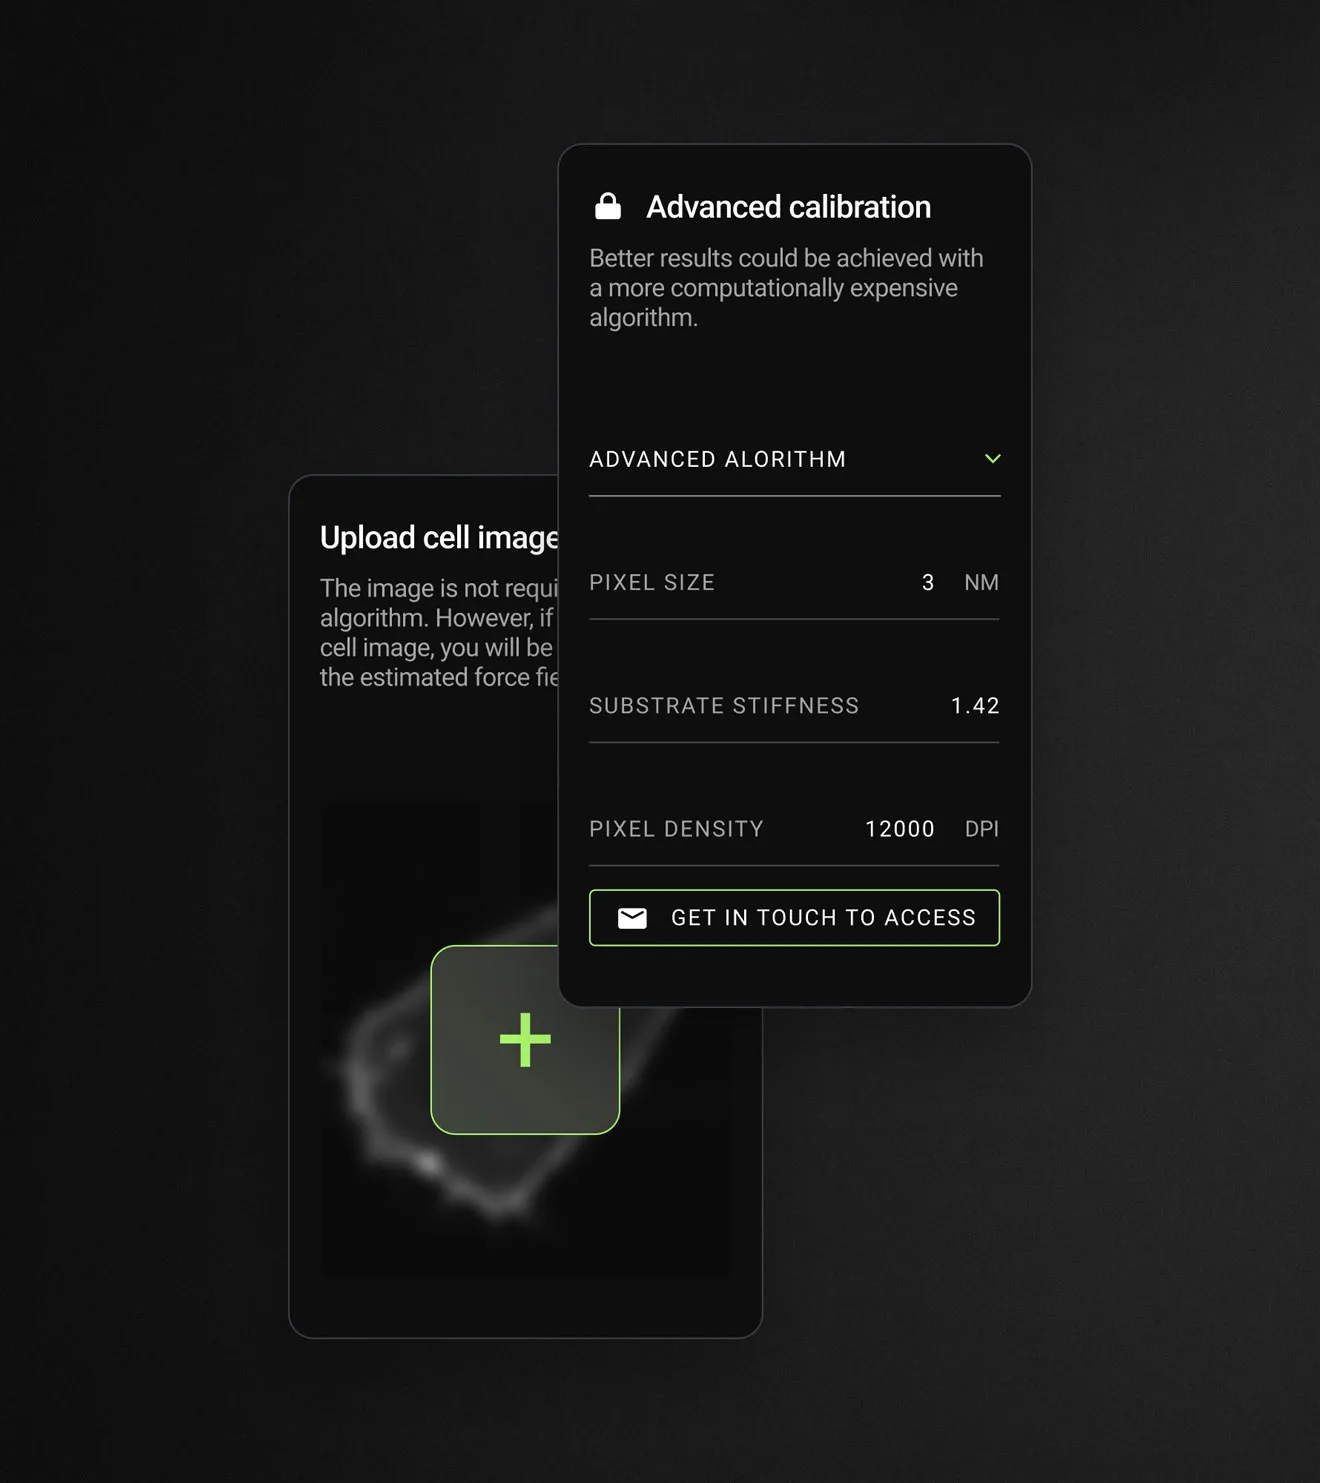
One step at a time. We studied how researchers would use the tool and designed a guided workflow: import images, set parameters, run the calculation, export results. Each step shows only what it needs, so a first-time user never faces every setting at once.
Checks before the run. Input checks flag unsuitable data or parameters before the analysis starts, so mistakes are caught before they become wrong results.
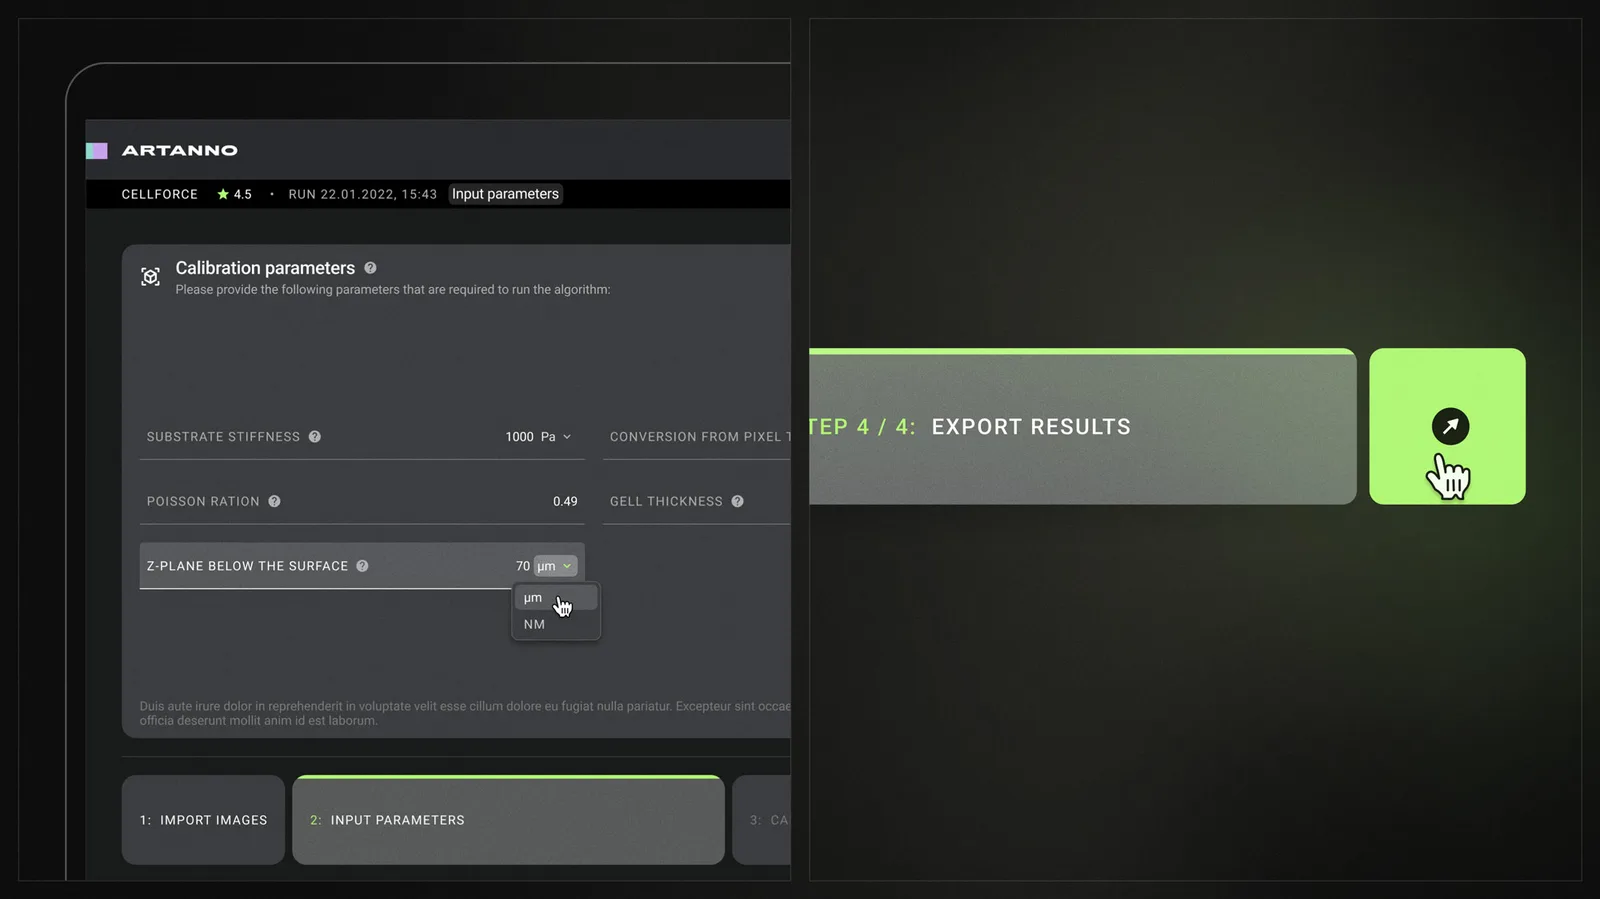
Tested with the people who would use it. We built a prototype, collected feedback on how the algorithm’s first users worked with it, and used that feedback and usage data to refine the workflow.
“I was impressed by the capabilities of the algorithm and the potential value it could bring to the scientific community. As soon as I saw the algorithm in action, I said to myself: wow, what if we made a design that could be accessible to every researcher, regardless of their computer science skills. Since then, my #1 goal has been to deliver the easiest, most intuitive bioimaging tool to the market.”
– Anton Elovikov, Designer at SamuylovAI
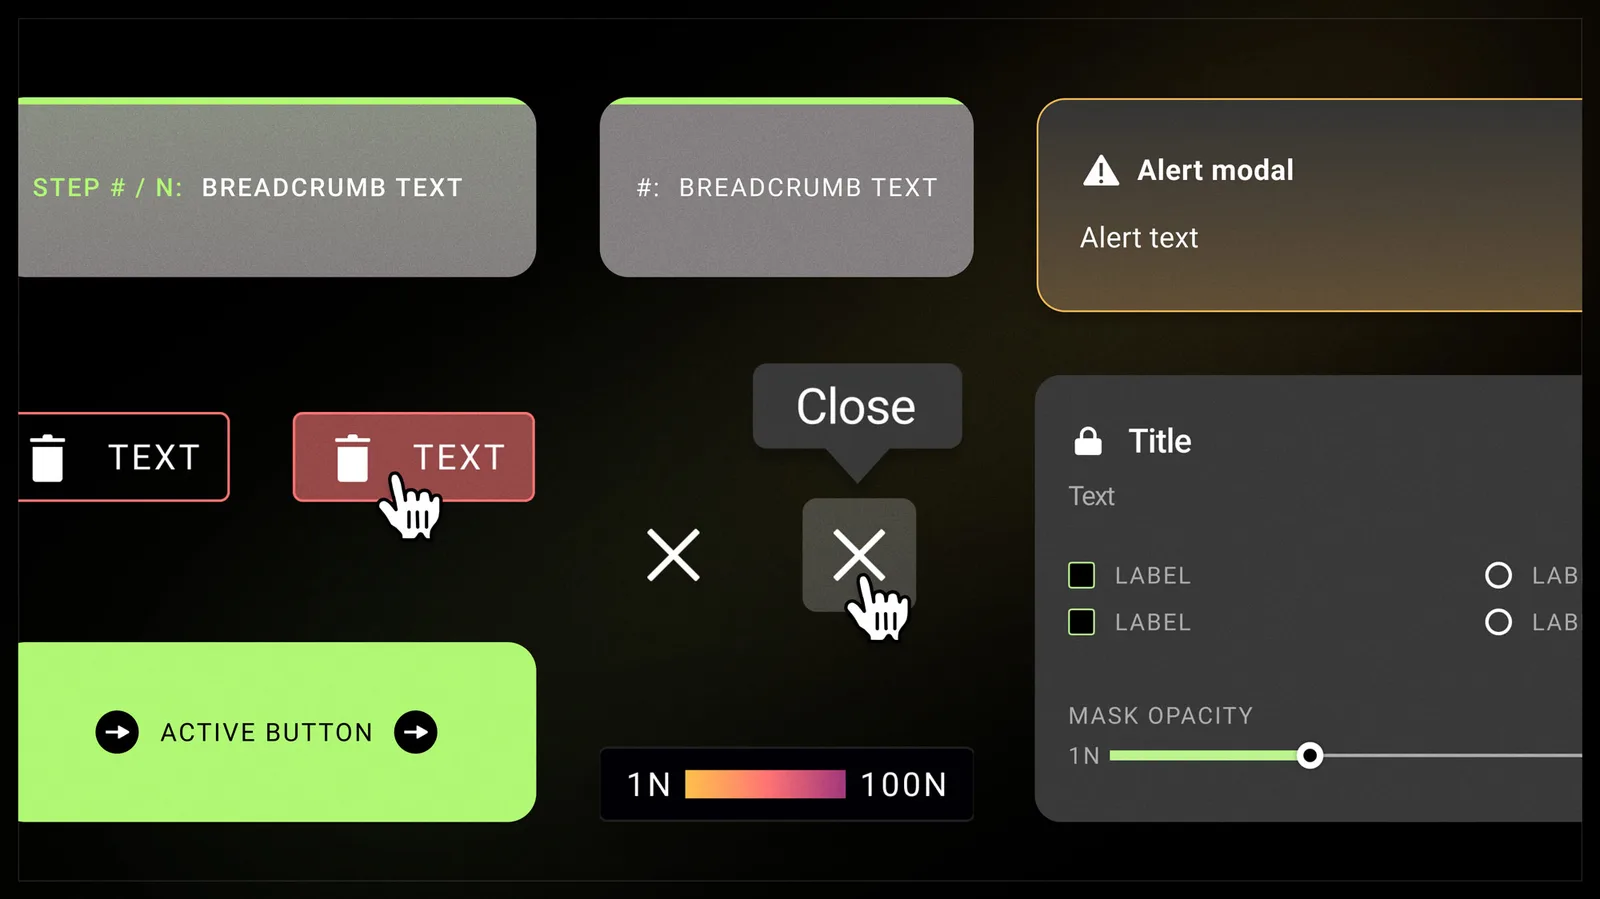
Built to take other algorithms. A design system of reusable forms, inputs and 2D and 3D microscopy views made each round of feedback quicker to apply. The production version keeps the interface separate from the algorithm behind it, so another algorithm can be added with little effort from its developer.
Results
#A working version in three months. Within the first three months, we designed the interface, tested it with users and launched the first version of the application. We then rebuilt it for production use. By the end of the engagement, BetzLab was using it in its own research.
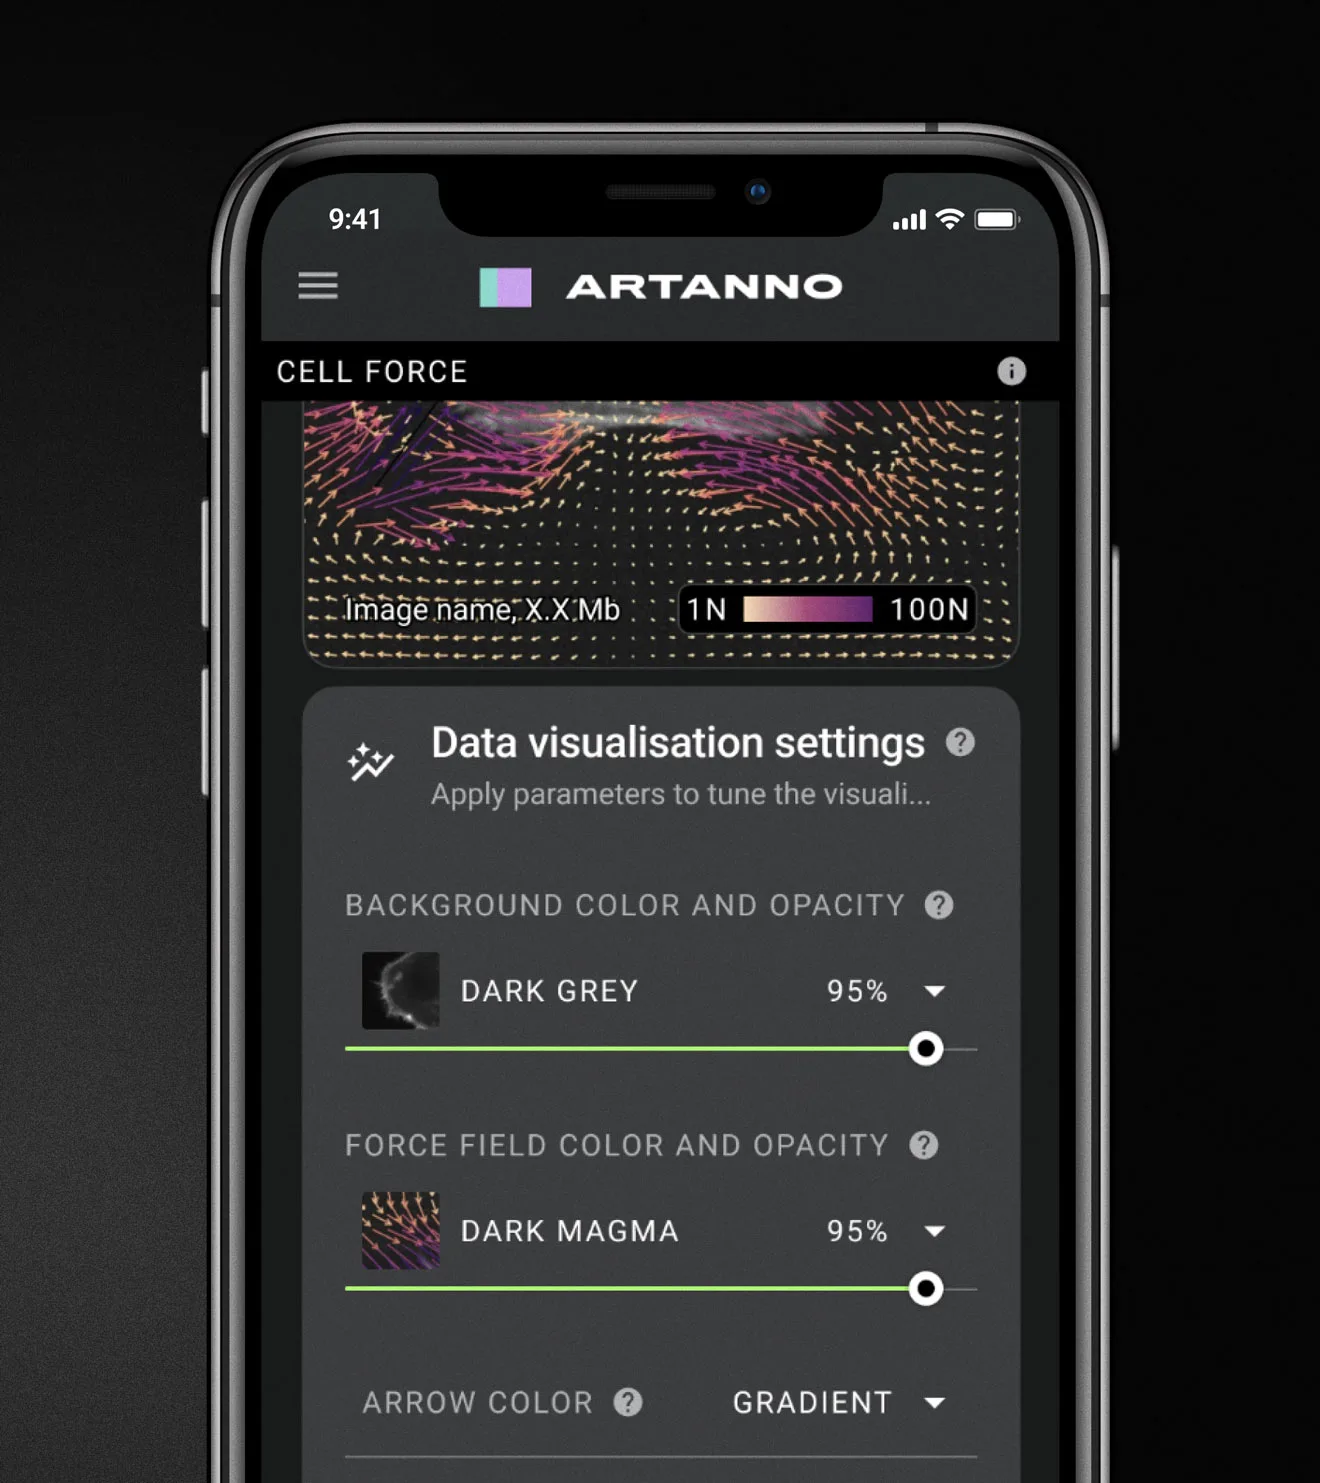
No installation. Collaborators run the algorithm and share results in a browser, on desktop, tablet or phone.
What transfers
#An algorithm only creates value when people can run it. If using it takes an installation and a programmer, its reach stops at the team that wrote it. A browser interface widens who can use it.
Check inputs before the run, not after. Users who cannot judge an algorithm’s internals cannot spot a bad result either. Checks on data and settings are what stop a wrong result from looking like a right one.
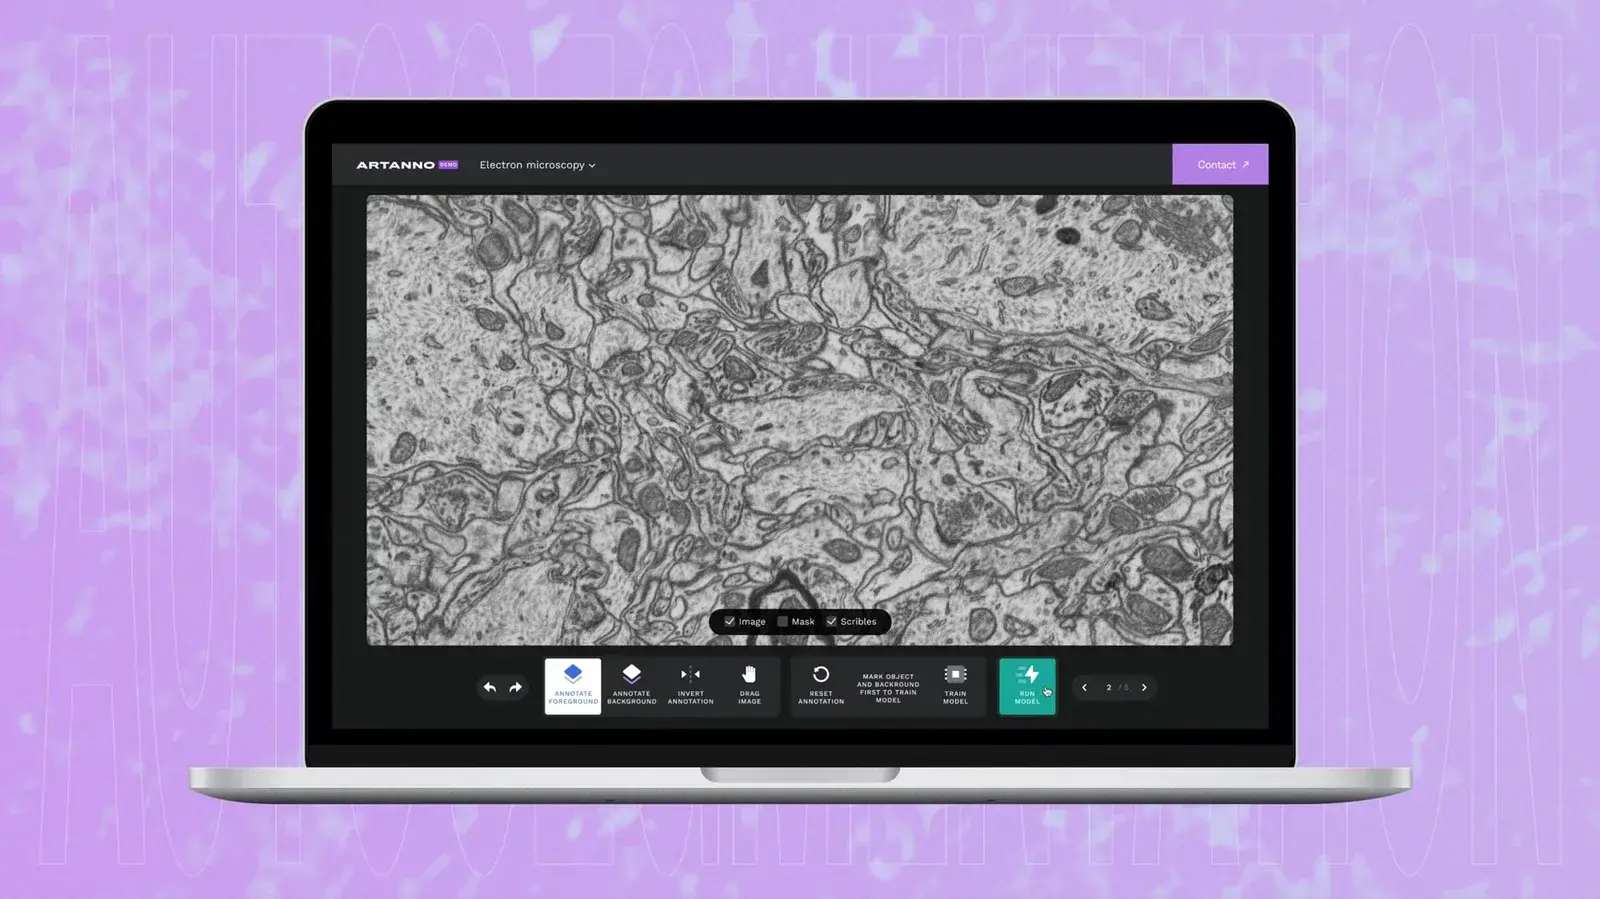
Separate the interface from the algorithm. The next algorithm can then reuse the workflow, the design system and the infrastructure instead of starting again. Our annotation assistant for microscopy images applies the same focus on the expert’s workflow.
Have an algorithm or model that only its authors can run? We can turn it into a tool your colleagues, collaborators or customers use in a browser. See Advisory & Implementation, or Start a conversation.